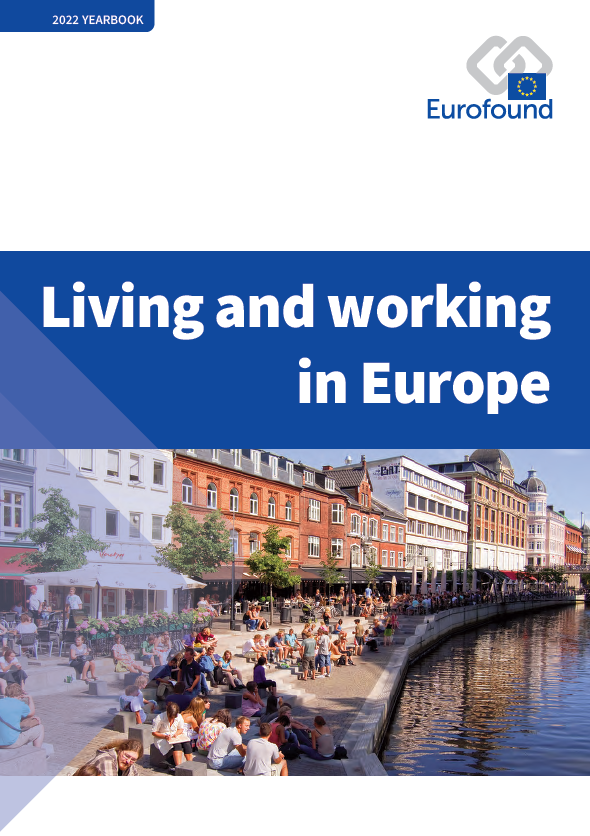
The year 2022 opened with cautious optimism. Europe was emerging from two years of the COVID-19 pandemic, with NextGenerationEU setting out a plan for a recovery that builds a strong and sustainable future. The Russian attack on Ukraine early in the year changed the situation dramatically, however, creating new turmoil across the continent. In its work during the year, Eurofound documented the impact of the rising cost of living and other developments arising from the war on the economic and psychological well-being of Europeans. This 2022 yearbook also summarises findings from the Agency’s signature survey on working conditions during the pandemic, its reporting of trends in employment and its study of the potential role of social dialogue in the green and digital transition. Eurofound’s research on working and living conditions in Europe provides a bedrock of evidence for input into social policymaking and achieving the Agency’s vision ‘to be Europe’s leading knowledge source for better life and work’.
The report contains the following lists of tables and figures.
List of tables
Table 1: Top three jobs with biggest employment losses, EU27, Q4 2019–Q4 2021
Table 2: Top three jobs with biggest employment gains, EU27, Q4 2019–Q4 2021
Table 3: Top 6 retail banking occupations in 2011 and 2021, EU27
Table 4: Job demands and job resources included in the EWCTS 2021
List of figures
Figure 1: Employment level (in thousands), by quarter, EU27, 2019–2021
Figure 2: Year-on-year change in actual weekly hours worked, EU Member States, Q4 2020–Q4 2021 (hours)
Figure 3: Year-on-year change in the unemployment rate (percentage points), by age group, EU27, 2020–2021
Figure 4: Employment shifts in job–wage quintiles (millions), EU27, Q4 2019–Q4 2021
Figure 5: Employment shifts in job–wage quintiles (millions), by gender, EU27, Q4 2019–Q4 2021
Figure 6: Year-on-year changes in employment across sectors, by gender, EU27, Q4 2020–Q4 2021 (%)
Figure 7: Job vacancy rates, by sector, EU27, Q4 2022 (%)
Figure 8: Total number of announced job losses and job gains, EU27, February–December 2022
Figure 9: Number of cases of announced job loss and job gain in financial services, EU27, 2008–2021
Figure 10: Number of bank branches per 100,000 inhabitants, EU Member States, 2004 and 2020
Figure 11: Prevalence of telework, retail banking and other sectors compared, EU27, 2008–2021 (%)
Figure 12: Changes in minimum wages in real terms, EU Member States, January 2021–January 2022 (%)
Figure 13: Proportion of EU employees earning minimum wages, by sector and occupation, 2018 (%)
Figure 14: Private sector collective bargaining coverage, EU Member States, 2019 (%)
Figure 15: Private sector collective bargaining coverage and predominant level of agreements, EU27, 2019 (%)
Figure 16: Job quality breakdown by sector, EU27 (%)
Figure 17: Exposure to high level of physical risks, by sector, EU27 (%)
Figure 18: Exposure to types of intimidation, by sector and gender, EU27 (%)
Figure 19: Expected undesirable change in workplace situation, by sector, EU27 (%)
Figure 20: Workers who work 48 hours or more per week, by sector, EU27 (%)
Figure 21: Health and safety at risk because of work, by sector, EU27 (%)
Figure 22: Poor fit between working hours and family and social commitments outside work, by sector, EU27 (%)
Figure 23: Degrees of autonomy, influence of computerised system and a supervisor compared, EU27 (%)
Figure 24: Preferred frequency of working from home, by gender, EU27, 2022 (%)
Figure 25: Workers with poor work–life balance, by gender and telework arrangement, EU27, 2021 (%)
Figure 26: Employees working from home, by occupational group, EU27, 2020 (%)
Figure 27: Share of full-time employees working long weekly hours, by telework arrangement, EU27, 2021 (%)
Figure 28: Share of full-time employees who worked during their free time, by telework arrangement, EU27, 2021 (%)
Figure 29: Working time preferences, by usual weekly working hours, EU27 (%)
Figure 30: Unpaid work activities, by gender, EU27 (%)
Figure 31: Paid and unpaid hours of work among women, by number of children, EU27
Figure 32: Paid and unpaid hours of work among women and men, by number of children, EU27
Figure 33: Well-being scores, by age group, 2020–2022
Figure 34: Prevalence of negative feelings, by age group, EU27, 2020–2022 (%)
Figure 35: Prevalence of risk of depression, by age group, EU27, 2020–2022 (%)
Figure 36: Ability to make ends meet by level of difficulty, EU27, 2020–2022 (%)
Figure 37: Unmet healthcare needs of respondents with and without disabilities, EU27, 2021 (%)
Figure 38: Unmet healthcare needs, by type of healthcare, respondents with and without disabilities compared, EU27, 2021 (%)
Figure 39: Risk of depression and loneliness, respondents with and without disabilities compared, EU27, 2021 (%)
Figure 40: Arrears, by type of healthcare, respondents with and without disabilities compared, EU27, 2021 (%)
Figure 41: Trust in institutions – mean scores (scale 1–10), 2020–2022, EU27
Figure 42: Trust in national government by ability to make ends meet (scale 1–10), 2020–2022, EU27
Figure 43: Performance of EU on six World Governance Indicators, 2008–2020
- Number of pages
-
72
- Reference nº
-
EF23016
- ISBN
-
978-92-897-2323-7
- Catalogue nº
-
TJ-AM-23-001-EN-N
- DOI
-
10.2806/063917
- Permalink
Cite this publication
Eurofound (2023), Living and working in Europe 2022, Publications Office of the European Union, Luxembourg.